
Ohio's wastewater map doesn't match its data center map
The discharge geography is concentrated in 10 counties. The buildout isn't following it.

Ohio is in the middle of the largest industrial buildout it’s seen in a generation. Intel’s $20B fab in Licking County, now targeting first production around 2030. Data centers stacking up across Franklin, Licking, and adjacent counties. Battery plants. Logistics. Everything that follows when a foundry anchors a region.
All of it needs the same thing eventually: a legal path to discharge wastewater. Through a publicly owned treatment works (POTW), through a permitted industrial outfall, through a regional water authority. Not “any river that looks close on a map.” Not the storm drain. A National Pollutant Discharge Elimination System (NPDES) permit, reviewed against the receiving plant’s actual capacity to handle the load.
That capacity is finite. And it's not showing up as a primary screen in most site selection — at least not yet for the AI buildout.
Why now
Three things are happening:
One. Intel’s Ohio One campus is in active construction. The first fab’s process wastewater profile will hit Ohio EPA’s NPDES process in the next 24 months. Industrial process water at fab scale is not municipal sewage — it negotiates limits, pretreatment requirements, and monitoring against the receiving plant’s headroom. The Licking Regional Water District just approved a new $200M treatment facility at Raccoon Creek specifically to handle this expansion. That’s one fab, one regional response, after a multi-year permitting fight.
Two. Ohio EPA proposed its first-ever general NPDES permit for data centers in late 2025 (OHD000001). The public comment period closed January 16, 2026. The final permit is pending. Whether it’s approved as drafted determines whether every new data center in Ohio gets fast-track coverage under one framework or has to file individually — which means longer timelines, site-specific review, and case-by-case headroom negotiations.
Three. The queue is forming. Every project that files first locks in allocation against finite plant capacity. Every project that files late pays for upgrades, hauling, redesign, or relocates. This isn’t a future problem. The order is being set right now, by which permit applications hit Ohio EPA’s queue first.
That’s the urgency. Not in 2030 when the fabs come online. Now, when the permits are being written.
What I measured
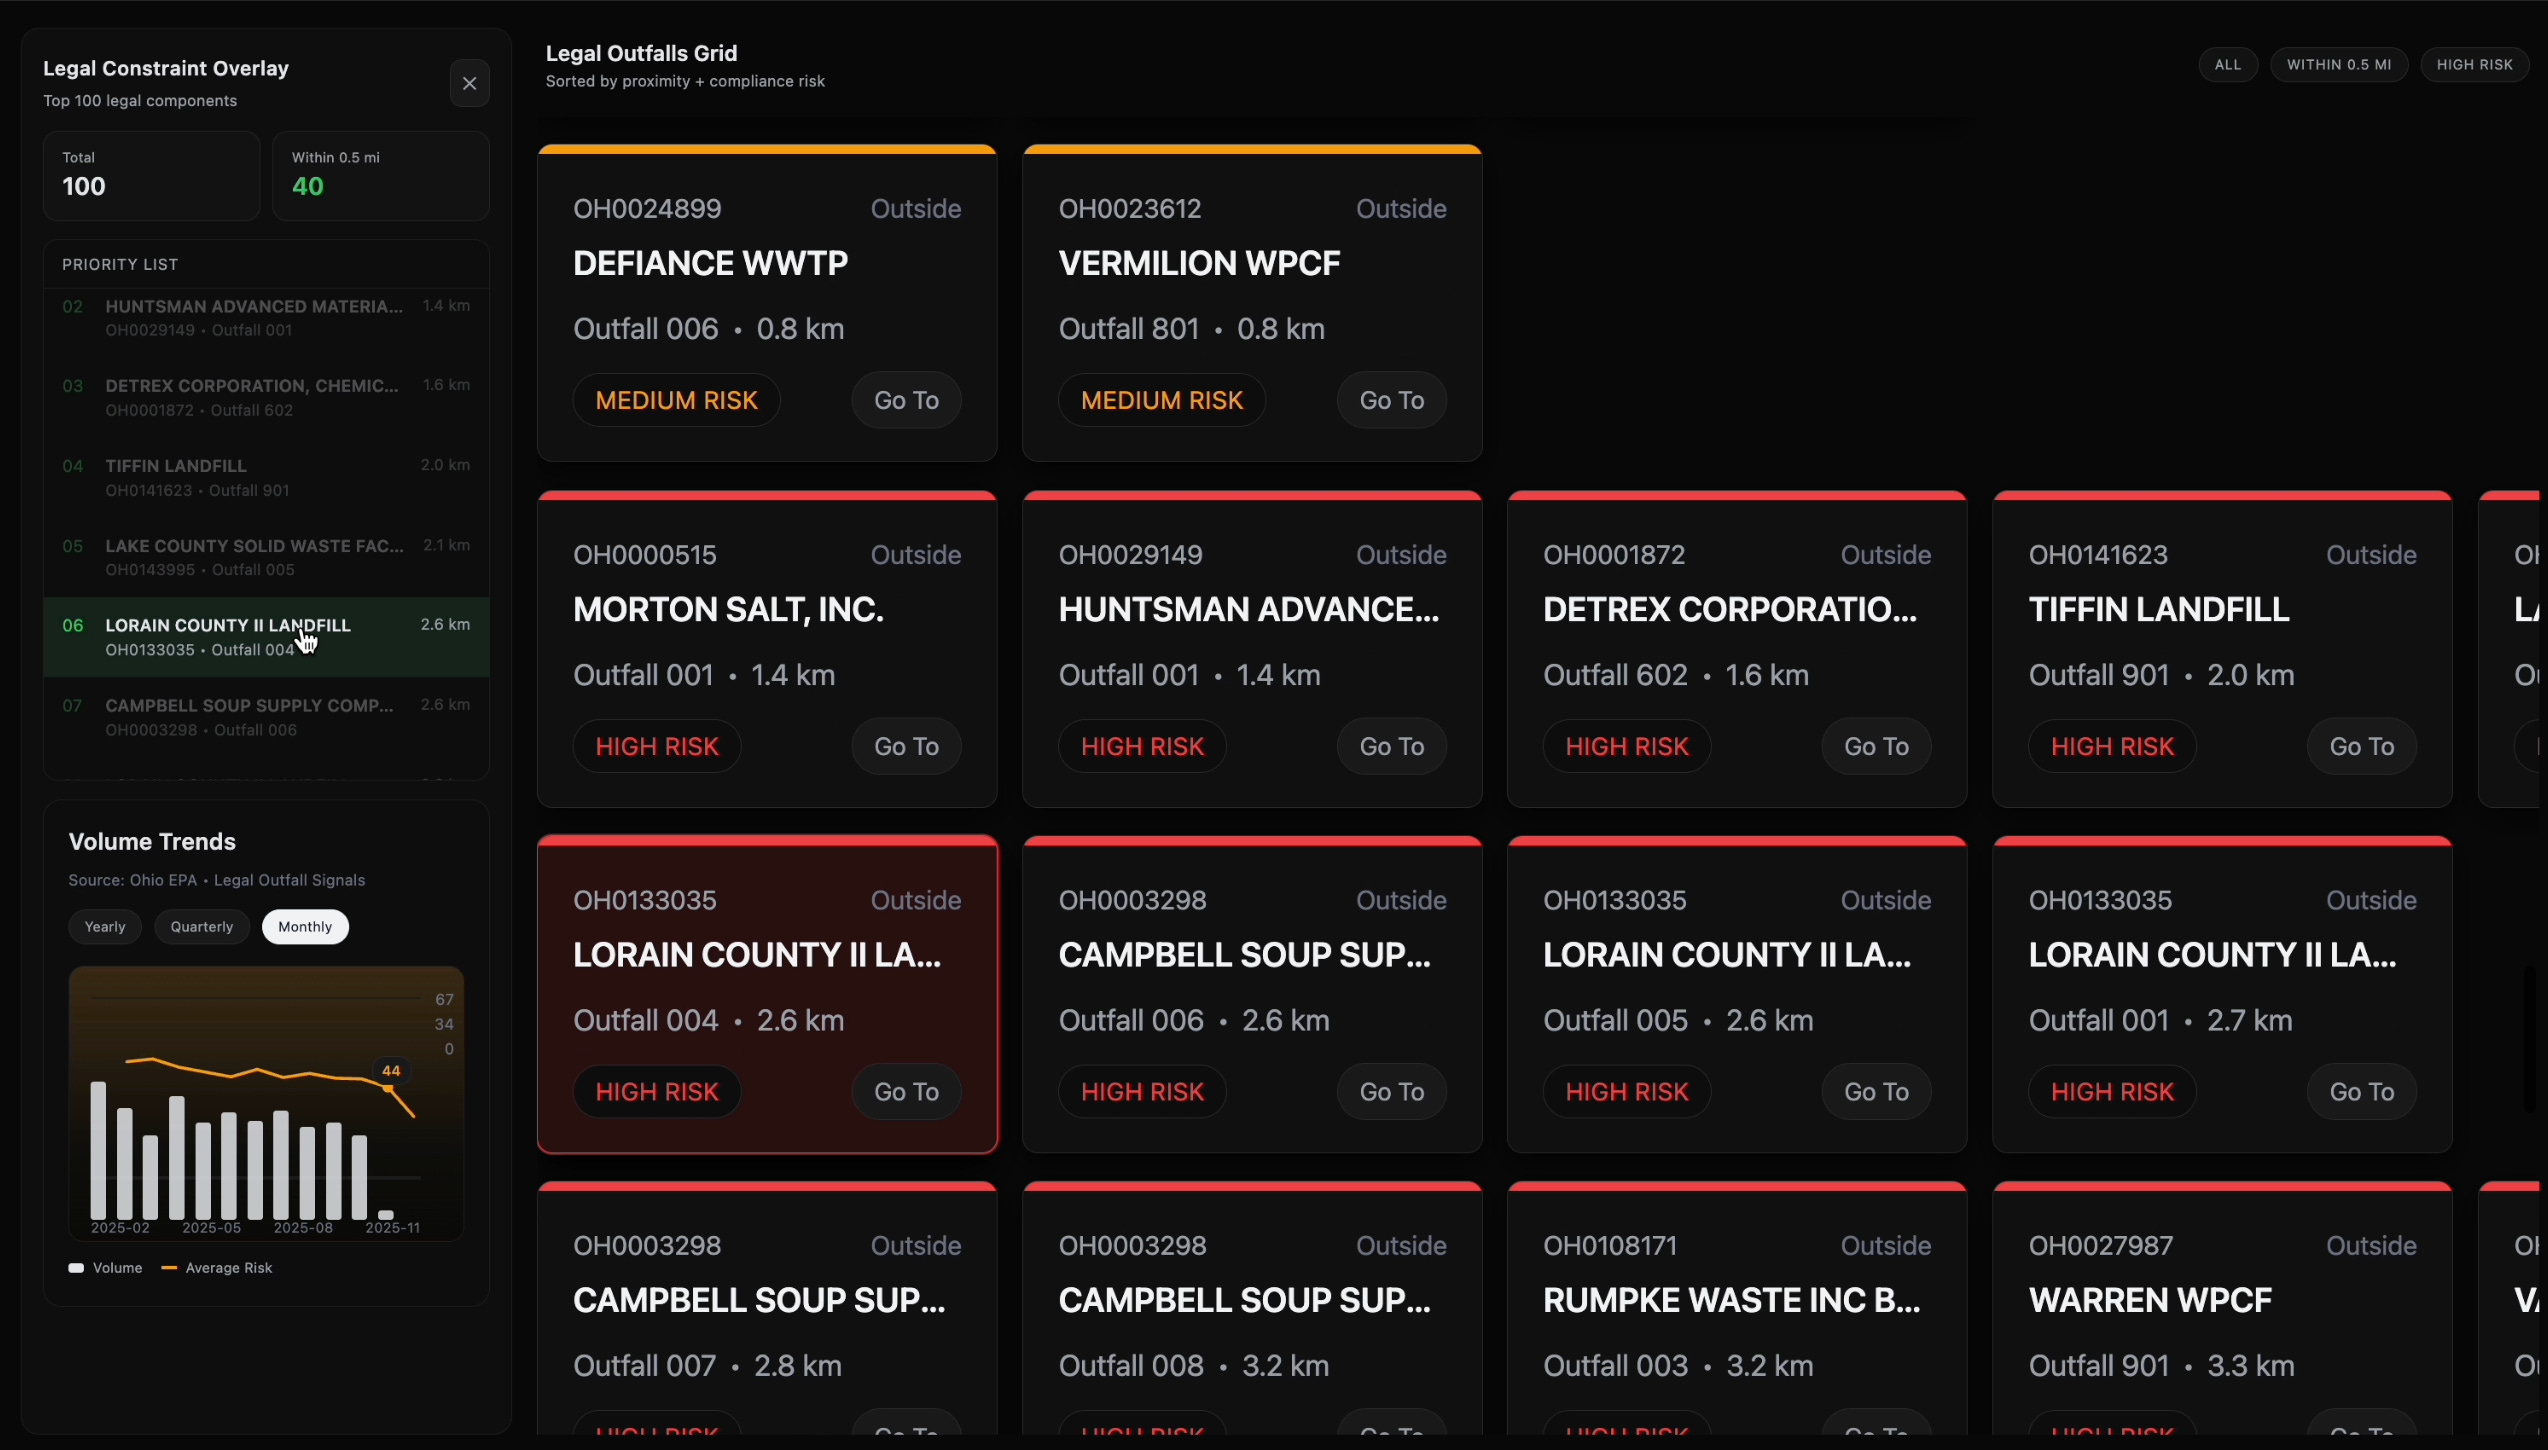
I started with Ohio’s NPDES universe. About 1,850 geocoded facilities, drawn from Ohio EPA’s individual permits database, crosswalked to facility coordinates. Underneath those facilities sit 6,400+ outfall-level rows — the actual discharge points, each with design flow (what the permit allows) and recent flow (what’s actually being used).
For each outfall where both numbers are reported, headroom is the difference:
headroom = design flow − recent actual flow, floored at zero.
I rolled those outfalls to county polygons and compared county-level headroom to a geocoded data center site list in the same counties. One caveat to surface up front: only about one in five outfalls has both design and recent flow data in the extract.
The map shows every geocoded facility. The headroom calculation is conservative — only about one in five outfalls report both design and recent flow, so the others get counted as zero
Counties with low reported headroom may have more slack than the data shows; counties with high reported headroom may have constraints that don’t surface until a specific project applies. The methodology is conservative — it counts only what’s observable.
That conservatism is the point. Even under the strictest “observed only” rule, the concentration is stark.
The concentration
The top 10 Ohio counties hold roughly 70% of statewide observed discharge headroom. Eighty-eight counties total. Ten of them control most of the usable slack.
That’s not how power distributes. Ohio’s grid is constrained but the constraint shows up almost everywhere — interconnection queues are long across most of the state. Wastewater headroom is the opposite: highly concentrated, geographically uneven, and not correlated with where projects are clustering.
Spearman correlation between county headroom rank and data center count rank: 0.40. Moderate, not strong. Clustering is not following headroom. It’s following power and fiber.
That’s the gap.
What this map doesn’t show
Headroom is hydraulic — raw gallons of permitted discharge capacity. It’s not a measure of whether a specific data center can lawfully send its cooling tower blowdown there. That’s a separate gate: chloride, total dissolved solids, conductivity, residual chlorine, treatment chemistry. Whether a POTW can accept industrial process water depends on the receiving plant’s existing permit limits and the chemistry of what arrives.
I could only pull chemistry data on about 3% of Ohio outfalls. So the map shows where the gallons are. It doesn’t show where the data centers can go. That’s a separate ruler, and almost no public dataset holds it well
Who loses when the constraint binds
Three groups, in order of how soon it shows up in their cost basis.
Late movers in tight corridors. Projects that announce after major permits and pretreatment agreements harden don’t just pay more for land. They pay for plant upgrades, hauling, or redesign. The first three or four big projects in a county set the operating envelope. Everyone after that operates inside it or pays to expand it.
Communities that assumed river access equals disposal access. NPDES is the legal gate. High-salinity industrial waste, semiconductor process water, and battery manufacturing byproducts often can’t route through municipal sewage without explicit permission and plant capacity that doesn’t yet exist.
A general permit that treats all data centers the same — regardless of cooling technology, water chemistry, or location — folds what should be three separate technical conversations into one. Whether that's the right tradeoff is a real policy question, and it's a question Ohio EPA hasn't yet answered.
Anyone pricing land on interconnection alone. Megawatts queued and gallons withdrawn are the wrong first screen if discharge is the long-run constraint. The site that has power and water on paper but no clear discharge path is a site that hasn’t actually cleared diligence.
What the map shows
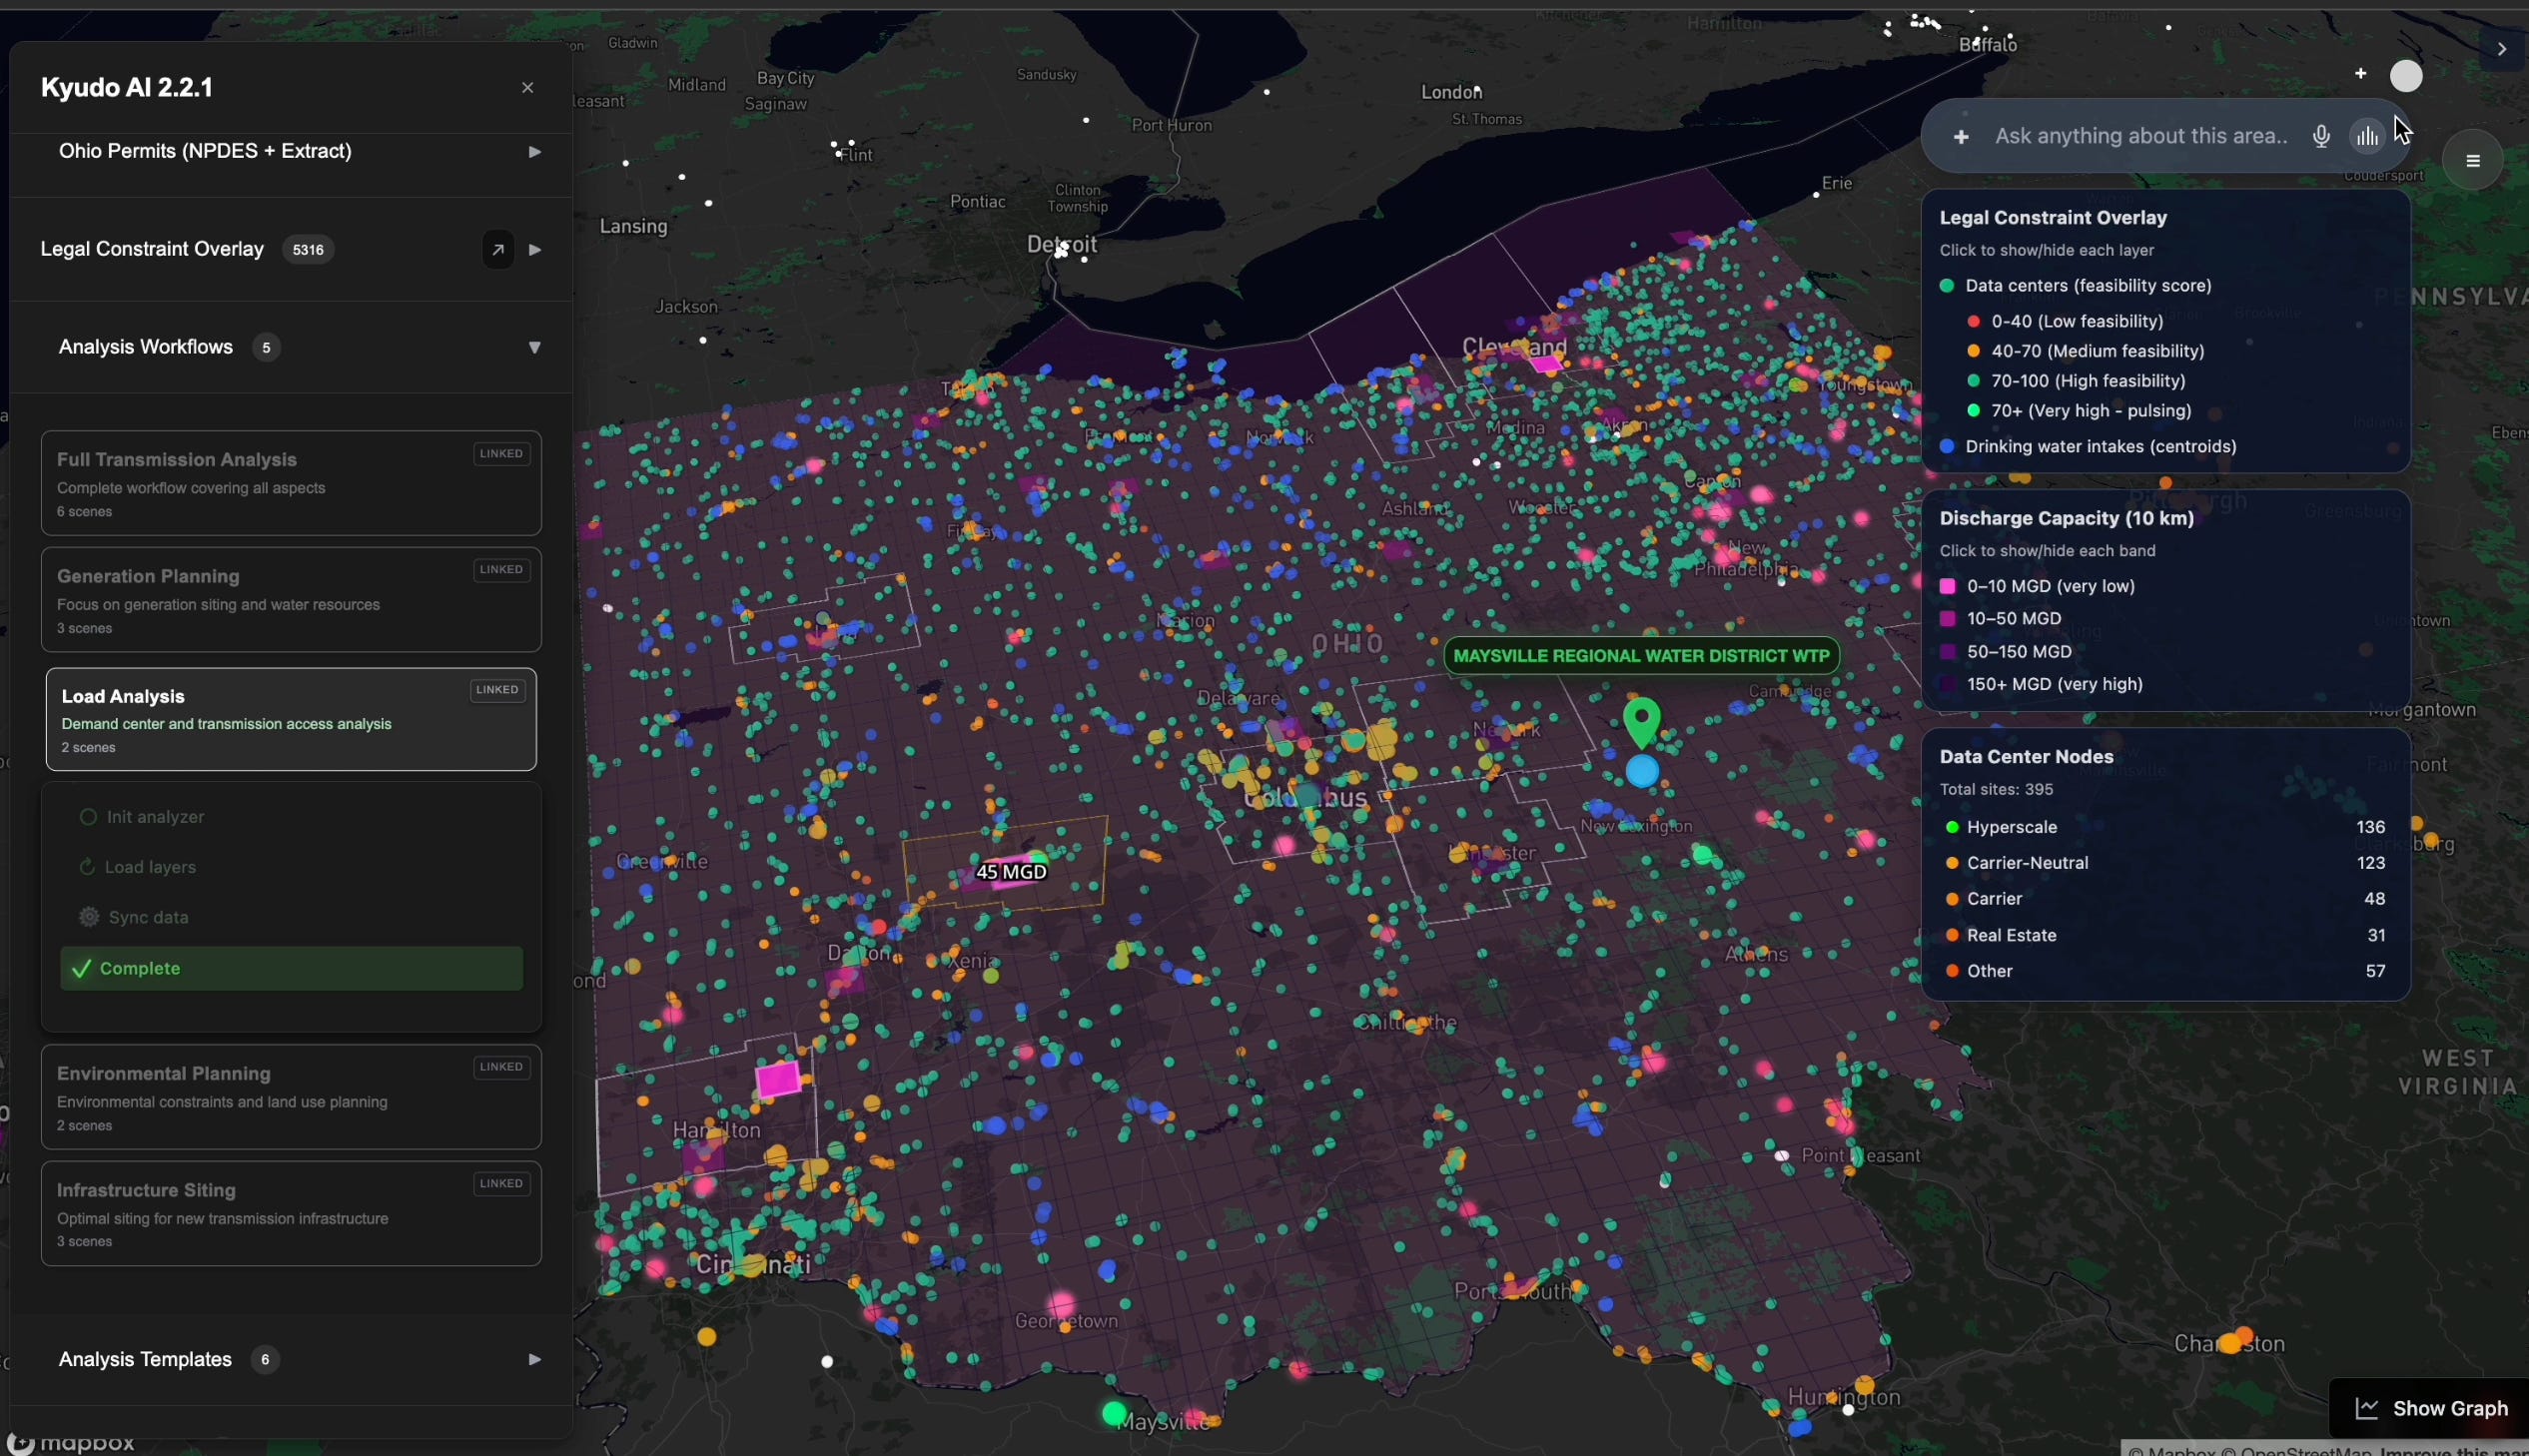
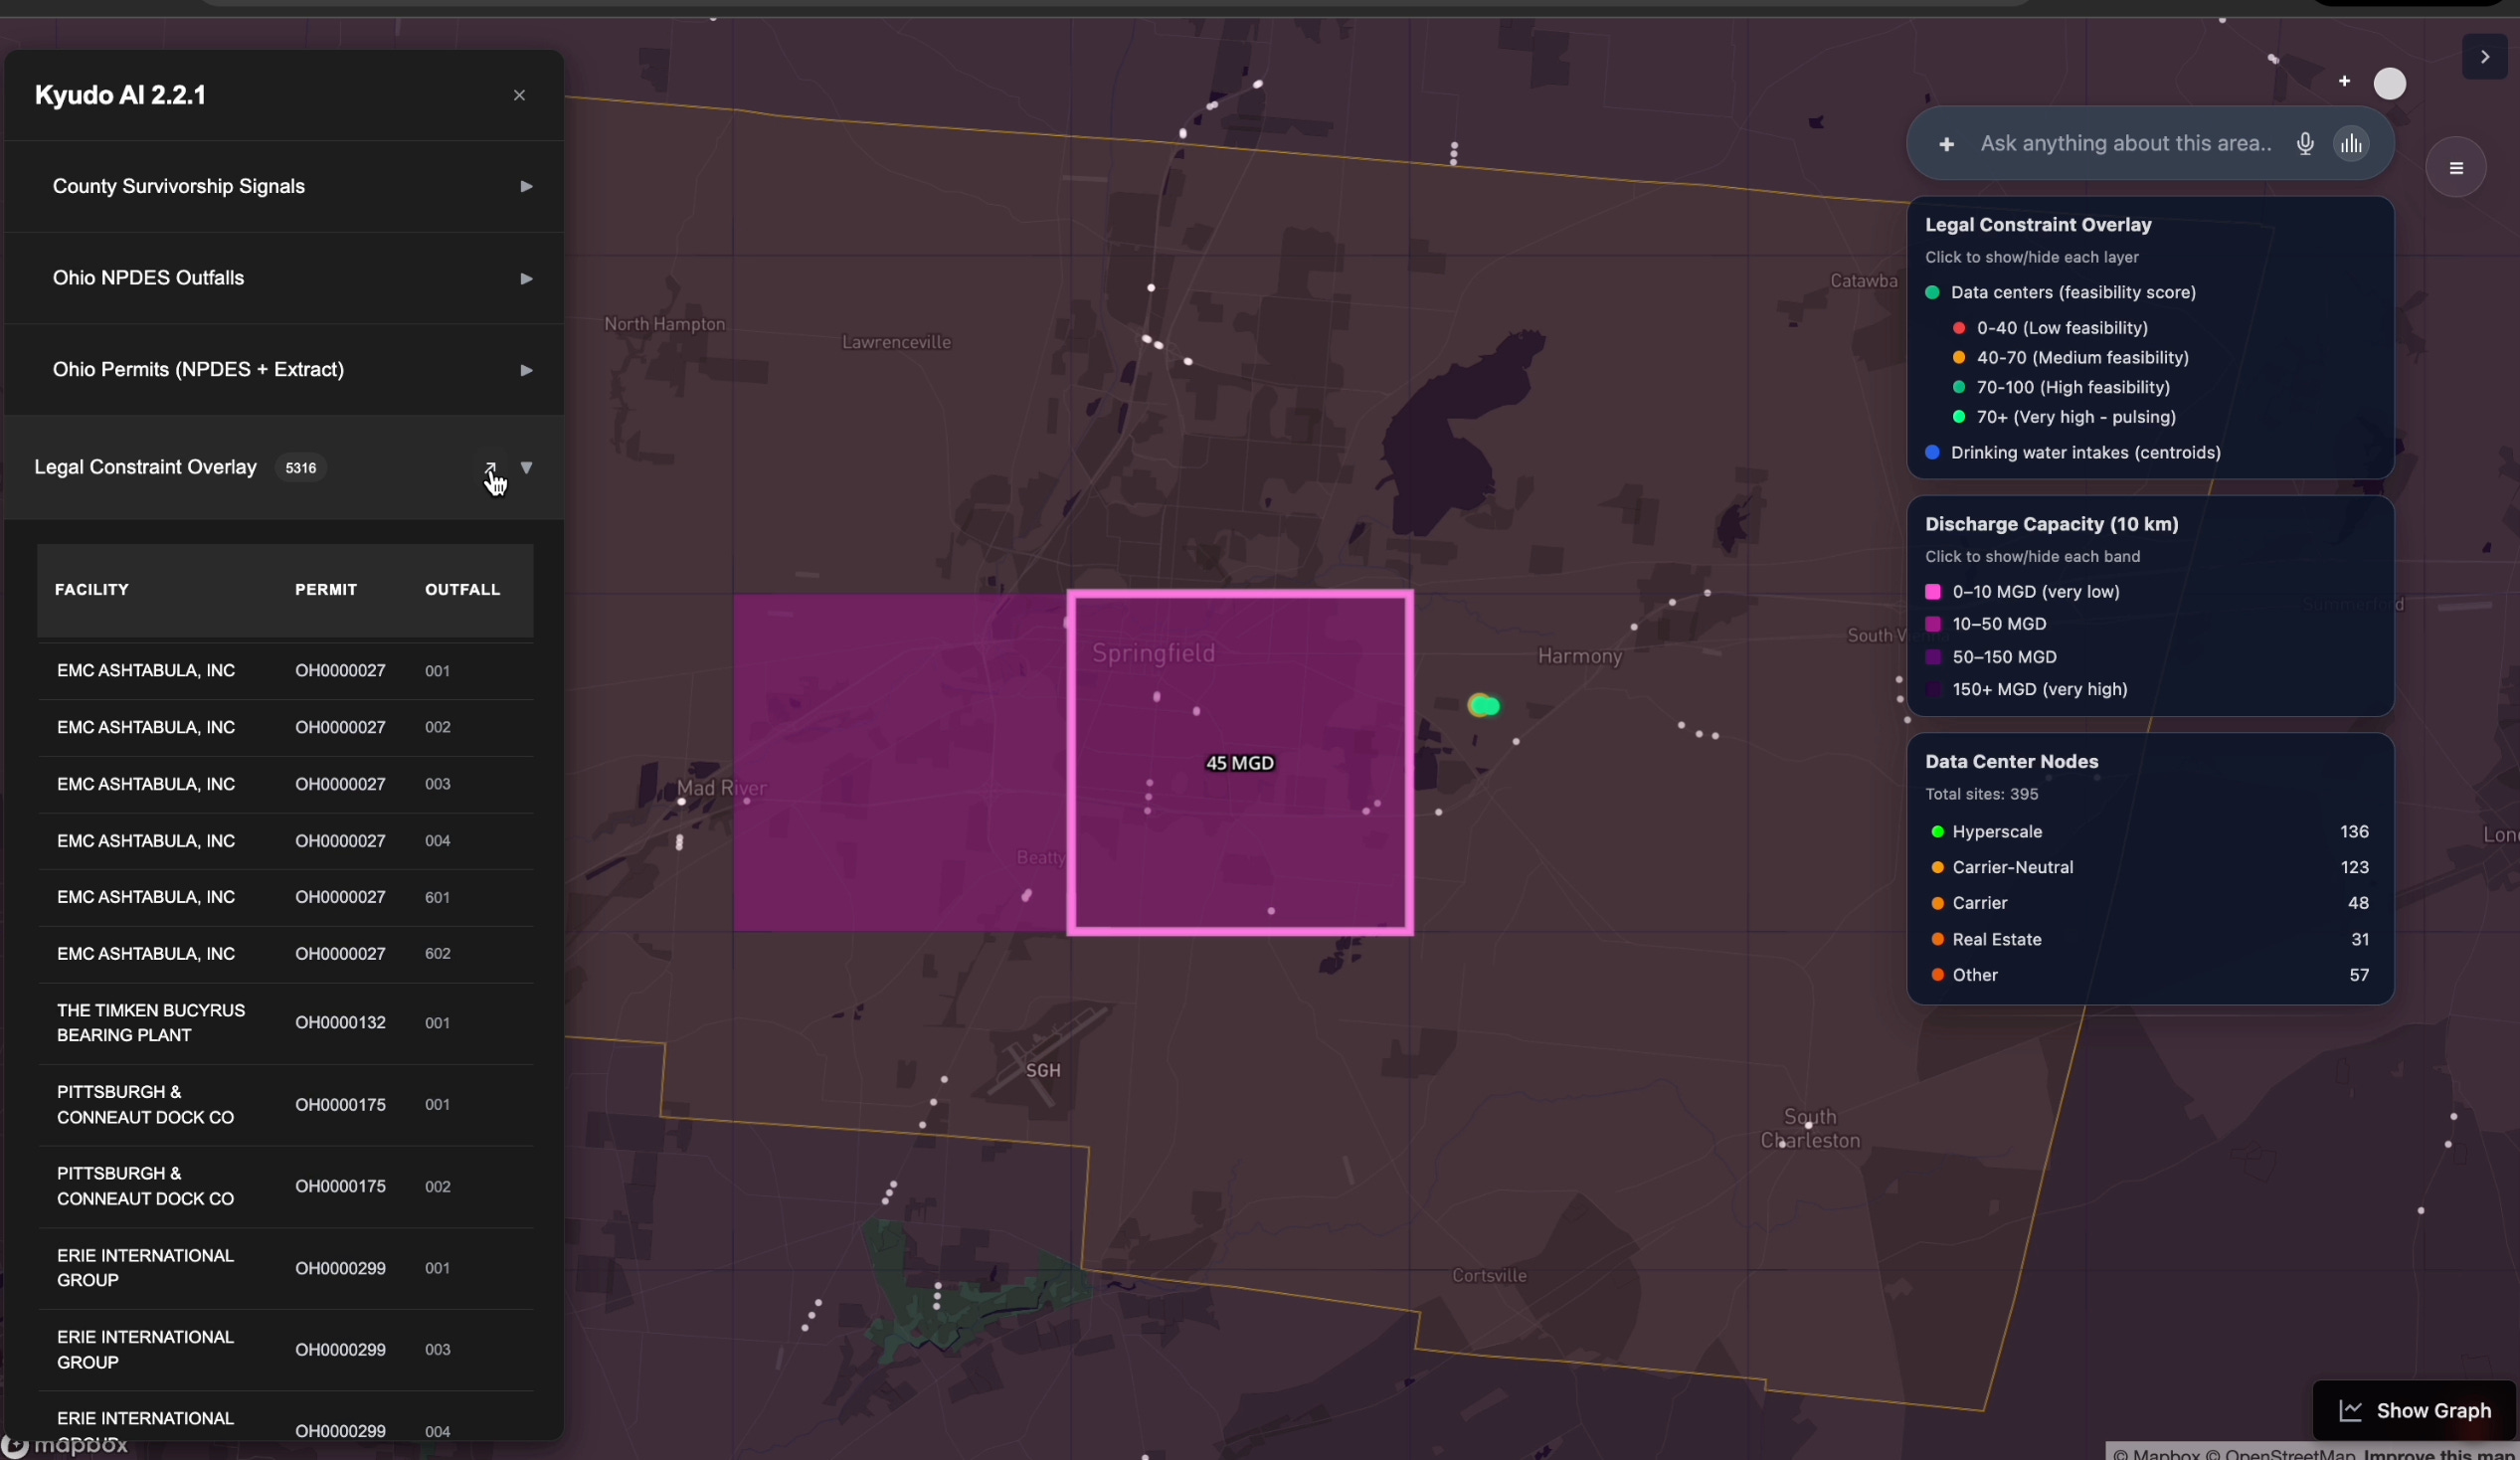
County-level discharge headroom, choropleth from aggregated outfalls. NPDES facility locations and outfall points layered underneath. Data center sites in the same frame, so you can see where slack exists vs where projects are clustering.
The comparison rules match the tables. No fantasy layers, no projected capacity, no forecast headroom. Only observed headroom from reported design and recent flow.
The map shows Franklin lit up with both headroom and clustering. Belmont and Lorain showing significant headroom and nothing else. Licking in the middle, Intel’s anchor visible. Most of southern and eastern Ohio with headroom that no project is queueing against.
That’s the geography of the next five years if nothing changes.
What’s next
Switchyard currently covers Texas. The Ohio dataset behind this analysis — facility-level NPDES, county-level headroom, the data center geography — is the foundation for the Ohio expansion. If you work in Ohio and want to search a specific address, the wait is real but the data is being readied.
The bottom line
Land in Ohio is still being priced like power is the bottleneck. The real picture is more complicated. Hydraulic capacity is finite and concentrated. The chemistry that determines whether a specific site can actually use it is even more uneven. Both rulers point in the same direction: the site that has power and water on paper but no clear discharge path hasn’t actually cleared diligence.”
Intel’s 2030 timeline is when the fab’s wastewater story stops being slides and starts being permits and meters. The data centers stacking up behind it will be deciding their discharge paths in the same window.”
The constraint isn’t the fab. It’s the pipe out of it.
Sources and methodology
Primary sources
Ohio EPA — Draft General NPDES Permit OHD000001 (data centers)
U.S. EPA — National Pollutant Discharge Elimination System (NPDES)
U.S. EPA — National Pretreatment Program (POTW / industrial)
Licking Regional Water District — Raccoon Creek permit (Columbus Dispatch, May 2026)
Methodology
Headroom is calculated as design flow minus recent actual flow, floored at zero, only for outfalls where both flows are reported in the Ohio EPA extract. About one in five outfalls meet this criterion in the current dataset. County rollups sum outfall-level headroom within county boundaries. Data center sites are geocoded from a separate site list and spatially joined to the same county polygons.
The 70% concentration figure compares the top 10 counties’ summed headroom to the statewide total under the “observed only” rule. Concentration remains high under conservative bounds that zero out missing recent flow values.